
Deflation in 2026?
Hello all,
The holidays came and went in a blur of family time, full calendars, and more than our fair share of good food. The girls have been outside every chance they get, breaking in their new scooters and reminding us daily how fast time really moves. Letty’s holiday cookies didn’t help any of us feel lighter, but they did make the season sweeter. December brought another birthday for Emma, and January follows with birthdays for Olivia and Letty — small milestones that make this stretch of the year feel especially full. With so much happening at home and more on the horizon, there’s a lot to be grateful for.
And speaking of things moving… prices may finally be slowing down enough to catch their breath.
That brings us to a theme that keeps resurfacing as we look ahead to 2026: Deflation—or more precisely, a growing list of areas in the economy where prices are falling, not just rising more slowly (Disinflation).
Inflation, Disinflation, and Deflation
Before I dive in, I want to give you my thoughts on 2 potential scenarios for 2026:
A. Growth Up, Inflation Down (Deflation/Disinflation)
In this scenario, productivity gains—particularly from AI—keep GDP flat to modestly higher. Markets remain constructive, but leadership shifts toward quality. Technology can still perform, but not all tech is treated equally. Health Care and Utilities may play a larger role.
B. Growth Flat/Down, Inflation Down (Deflation/Disinflation)
In this environment, markets struggle. Bonds take on greater importance, equity exposure becomes more selective, and balance-sheet strength matters more than growth narratives. Technology tends to underperform. Value often does better than growth, Utilities tend to Consumer Discretionary outperform Financials, and Consumer Staples typically outperform.
While I view this as more of a second-quarter forward issue for 2026, my base case leans closer to Scenario A.
I suspect AI-driven capital spending to continue supporting productivity and, by extension, GDP. Where I’m less confident is the labor response. Hiring may remain selective rather than accelerate, and deflation is more likely to show up in pockets, not across the entire economy—but those pockets may grow over time.
That combination—steady output, uneven pricing, and restrained labor momentum—have a way of capping enthusiasm. It tends to encourage rotation rather than broad participation and can limit overall market upside. In that environment, I also suspect bonds may finally contribute more meaningfully to portfolios in 2026.
Put differently, a flat to modestly positive market year strikes me as a very reasonable outcome.
For now, that’s not what the market is pricing in. Momentum remains intact, and conditions still resemble much of what we saw in 2025. But, it’s worth stepping back and looking at the data that’s shaping this view.
First, let’s start with a quick refresher on the terminology.
Think of prices like a car. Inflation is acceleration—prices rising quickly, as we experienced in 2021 - 2022. Disinflation is easing off the gas—prices still rising, but at a slower pace 2023-2025. Deflation is when the car rolls backward—when the overall price level falls (2026?).
This distinction matters because deflation changes behavior. Consumers delay purchases, businesses lose pricing power, and debts grow heavier in real terms as dollars become more valuable.
To be clear, we are not there yet in the aggregate. Inflation remains positive, but it has cooled significantly from its peak. The next CPI reading is due mid-January 2026.
The more important story entering 2026 may not be “deflation everywhere,” but more parts of the economy quietly shifting from inflation to outright price declines.
Now, let’s look at where that cooling has shown up first and how it may continue.
Housing
Housing is often the first place where price pressure gives way—and that’s exactly what we’re seeing.
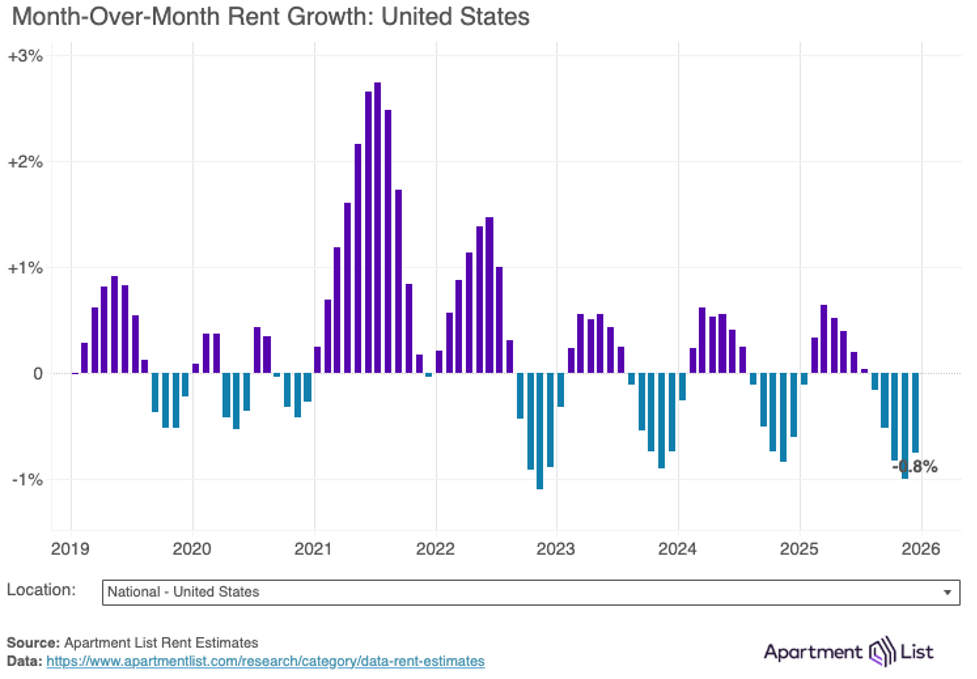
The rental market has been the clearest signal. Apartment List reports the national median rent fell 0.8% in December and is down 1.3% year-over-year (chart above), marking several months of declines and a meaningful pullback from the 2022 peak.
Zillow echoes this trend, noting cooler rent growth and forecasting muted rental increases into 2026, particularly in multifamily housing.
The home sales market has cooled as well. Redfin reports homes spent roughly 48.5 days on the market in 2025, the longest stretch since the pandemic period, and pending home sales declined late in the year.
Housing doesn’t need a crash to matter. It just needs to stop inflating—and in many places, it already has.
Manufacturing
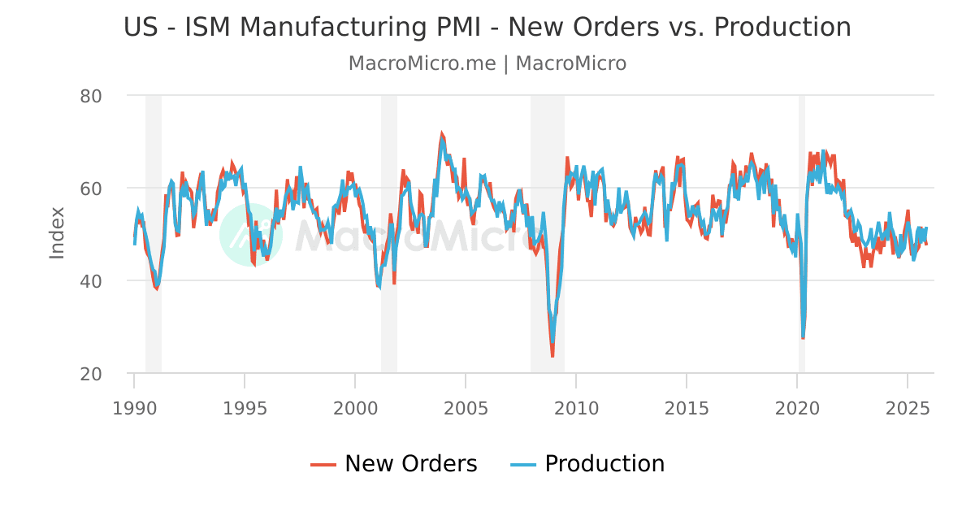
Manufacturing is sending a mixed—but telling—signal. Production is holding up even as demand cools. The Institute for Supply Management reported that December 2025 manufacturing activity remained in contraction, with new orders below 50, signaling softer demand, while the production index stayed slightly above 50, suggesting factories are still running.
When demand slows faster than supply adjusts, businesses don’t usually panic—they discount. That kind of price cutting doesn’t look like dramatic deflation, but it does show up as micro-deflation across parts of the goods economy, quietly pressuring margins.
Oil
Energy pricing remains a wildcard for 2026. Developments involving Venezuela and Nicolás Maduro have raised questions about future oil supply and sanctions dynamics.
That said, even if Venezuelan supply increases, it does not automatically mean “deflation” in oil. Oil is globally priced and influenced by OPEC policy, demand growth, geopolitics, refining constraints, and inventories. Still, additional supply—or even credible expectations of it—can contribute to downward pressure on gas prices, which would feel like relief to households and mechanically lower headline inflation.
But energy prices are cyclical and visible. The more consequential forces shaping 2026 are quieter and structural.
Labor, AI, and Deflation: When Capex Shifts from People to Processors
History tends to repeat the same lesson with different technology. Railroad speculation ended in the Panic of 1873, ushering in what many historians consider the longest economic depression in U.S. history. In 1929, innovation collided with leverage, and deflation magnified the damage. The dot-com bust of 2001 followed a familiar script: the internet changed the world, but valuations outran earnings. In 2008, housing didn’t need to collapse—prices simply needed to stop rising.
That history matters in 2026 because AI sits at a similar intersection of genuine transformation and extraordinary investment. Capital spending is increasingly concentrated in data centers, software, and compute, while hiring has slowed or become more selective. Job openings fell to roughly 7.1 million in November 2025, and the Federal Reserve’s Beige Book has described firms relying more on hiring freezes and attrition, while noting AI’s growing impact on certain roles.
Meanwhile, AI-related capex continues to scale rapidly. Goldman Sachs has highlighted the potential for very large AI-related capex into 2026, particularly around data centers and compute infrastructure.
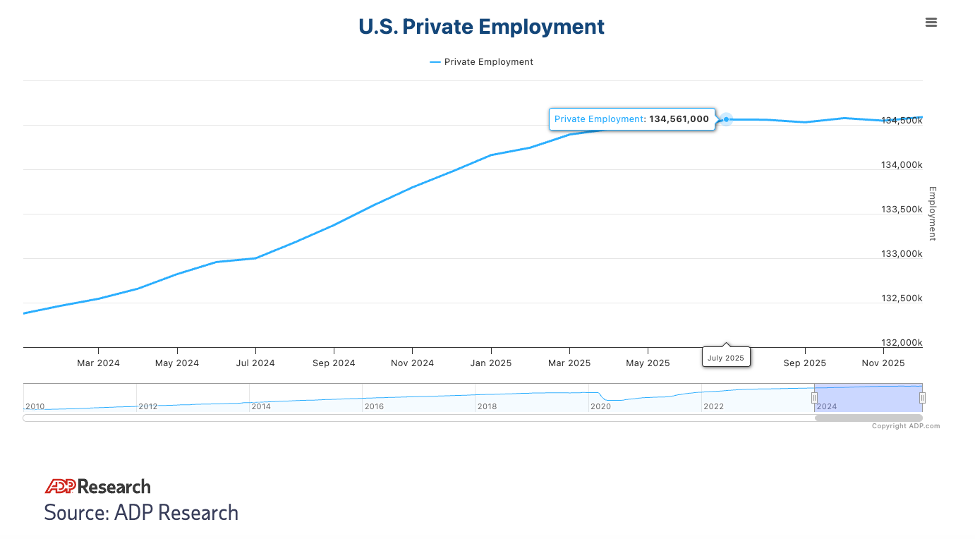
The chart above shows little to no job growth (roughly 50,000 added) since April of 2025. In addition, the U.S. added roughly 500,000 new jobs in 2025. For comparison, about 2 million jobs were added in 2024.
This shift—from people to processors—can boost productivity even as hiring cools, creating a “job-light expansion.” When wage growth lags output, consumption softens and pricing power weakens. That’s often where deflationary pressure emerges.
Side note to remember: Deflation doesn’t usually cause downturns; it reveals imbalances.
But, before we get ahead of ourselves, let’s take a look at the current market health using the charts on the next section.
The macro thesis is starting to form; however, the market is not confirming it yet.
Current Market Reality
Up to this point, we’ve outlined a framework for why deflation could become a second-quarter forward issue—cooling labor dynamics, productivity gains driven by AI, and pockets of price declines forming beneath the surface. That framework matters, but it also needs to be tested against what markets are actually doing today.
Markets are very good at sniffing out trouble early. One of the most effective ways to gauge that is through relative-performance or “pairs trade” charts. Rather than forecasting outcomes, these comparisons show where capital is flowing right now. They help answer a simple but important question: Is the market positioning for stress, or is it still leaning into growth and risk?
S&P500 Bullish Percent Index
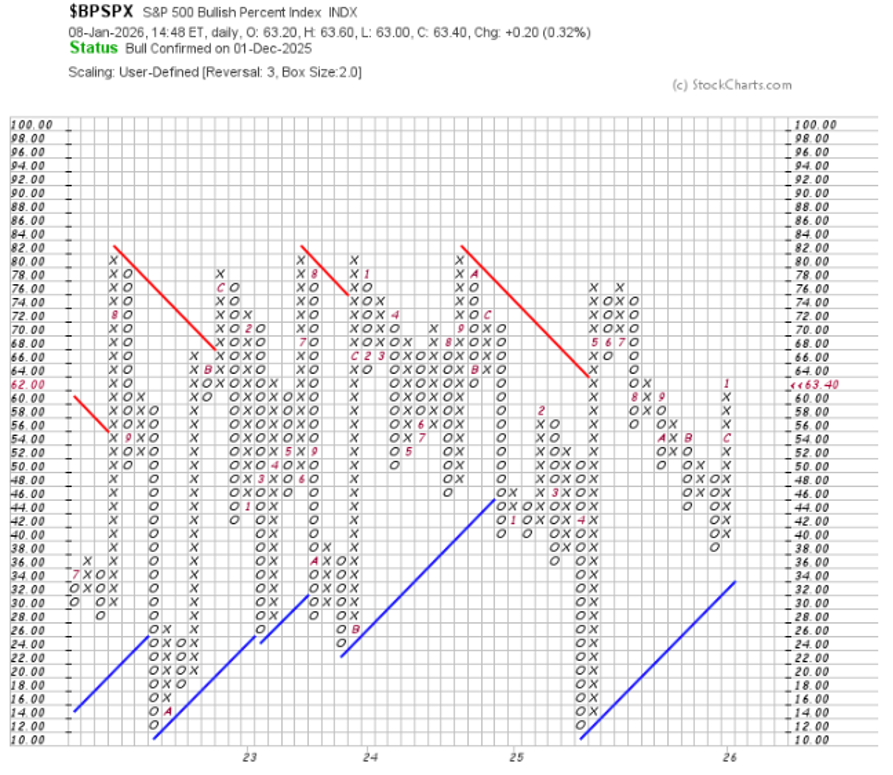
The bullish percent of the S&P 500 currently sits around 63.4%, a sharp rebound from roughly 38% in late November and early December. This indicator measures how many stocks in the index are on technical buy signals. When participation expands this quickly, it typically reflects improving breadth and underlying momentum—conditions more consistent with a healthy market than one bracing for economic trouble.
Consumer Staples vs. Consumer Discretionary
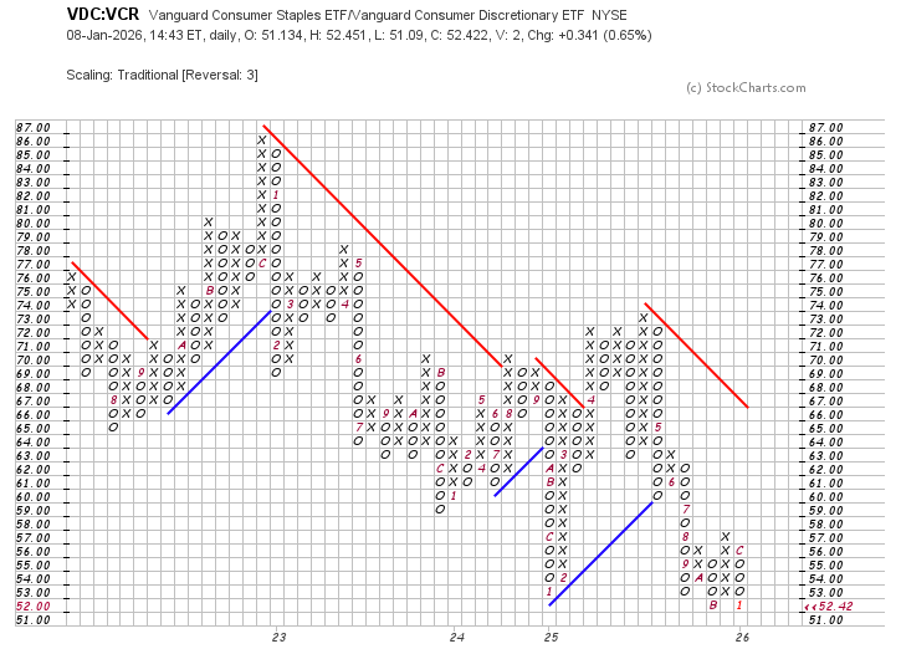
This is one of the cleaner gauges of economic confidence. When investors grow cautious, Consumer Staples tend to outperform Consumer Discretionary as spending shifts toward necessities. At the moment, staples continue to underperform discretionary. That tells us consumers—and investors—are still behaving as if growth is intact, not rolling over.
Utilities vs. Financials
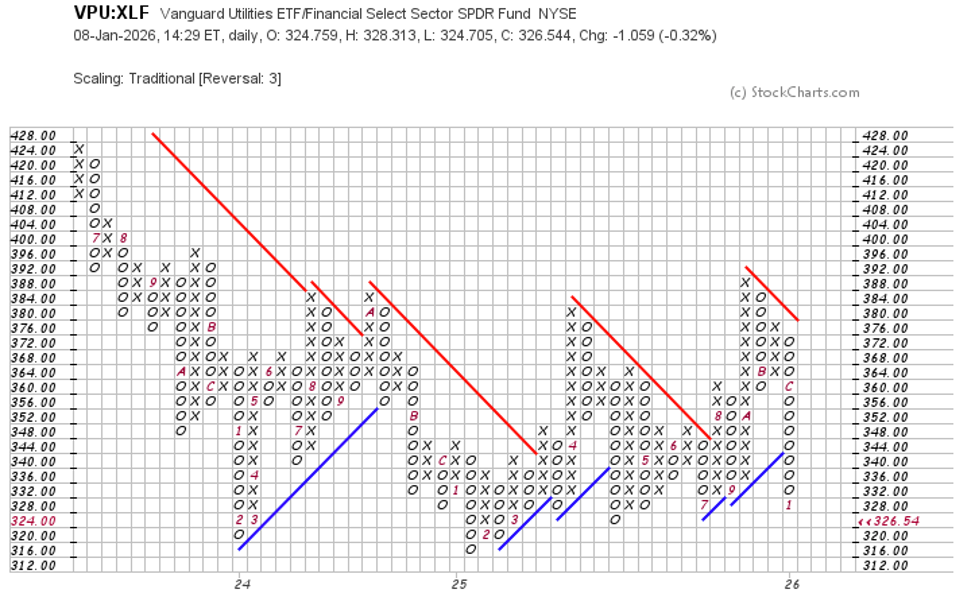
Utilities tend to benefit when growth slows and rates fall. Financials tend to perform better when economic activity is steady and credit conditions are healthy. The continued outperformance of Financials relative to Utilities reinforces the same message we see elsewhere: the market is still positioned for expansion, not defense.
High Yield (Junk Bonds) vs. Long-term Treasuries
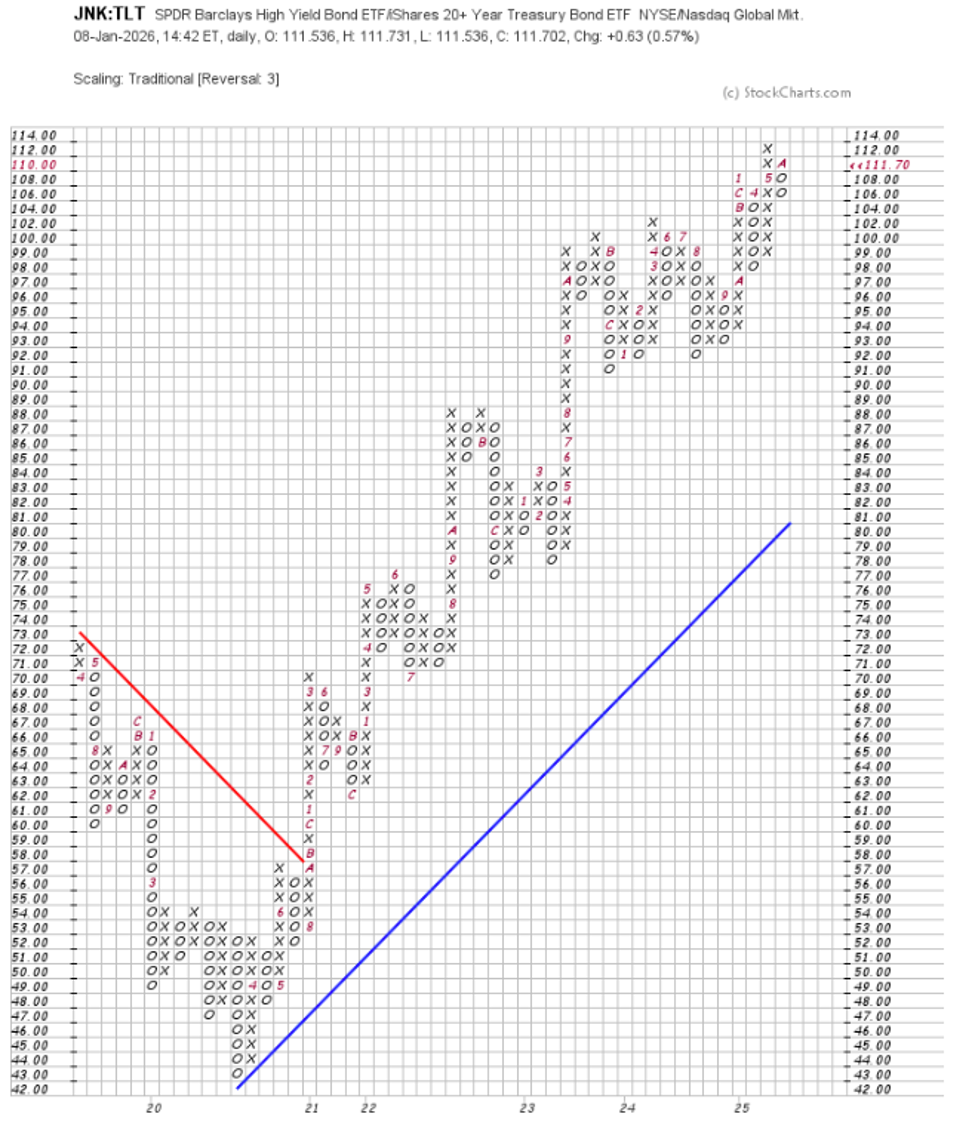
Credit markets often lead equities, and right now they are not flashing warning signs. High-yield bonds continue to outperform long-dated Treasuries, suggesting investors are comfortable taking credit risk. This relationship typically weakens well before recessions or deflationary stress. For now, it remains supportive of the broader risk-on narrative.
Taken together, these indicators tell a consistent story. Market breadth is improving, risk appetite remains intact, credit markets are cooperative, and defensive positioning is limited. In short, the market is not yet validating a deflationary environment—and that’s okay.
These charts don’t invalidate the possibility of deflation later in 2026. Instead, they give us a dashboard. If this thesis begins to develop, these are the areas where we would expect to see cracks first.
Conclusion
Deflation is a developing possibility, more likely in the second half of 2026 than the first.
There is no single playbook for deflation, and I do not expect a broad sweep across the economy. In practice, deflation is not automatically bearish—but it does tend to change leadership.
When pricing power becomes scarcer and growth cools, markets often begin to favor quality, balance-sheet strength, and durable cash flows. Defensive sectors such as Health Care, Utilities, and Consumer Staples become more relevant. Bonds tend to play a larger role as yields drift lower, while highly leveraged companies and deep cyclicals become less forgiving places to hide.
After the inflation shock of 2022–2023 and the disinflation story that followed, 2026 may be the year investors have to contend with selective price declines—particularly in housing, certain goods categories, and potentially energy.
That doesn’t mean betting the farm on deflation. It means staying flexible.
As we enter 2026, our focus remains on staying disciplined and responsive to the data, not the noise. Portfolios remain positioned for current market conditions, while we stay vigilant around evolving trends in labor, pricing, and market leadership that could become more relevant as the year unfolds. If conditions change, we’re prepared to adjust thoughtfully.
I’m also looking forward to reconnecting and catching up after the holidays—please don’t hesitate to reach out if you’d like to touch base.
Thanks for reading,
James
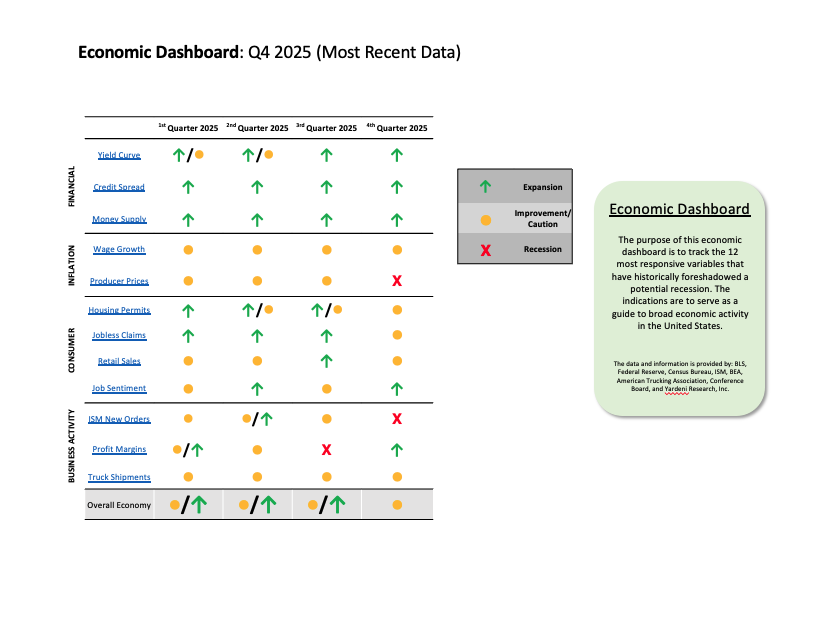
Economic Dashboard - Information
Yield Curve - A steeper Yield Curve shows that bond investor sentiment is more optimistic about economic activity moving into the future. If the 10 Year treasury minus the 3 Month Treasury provides a positive slope of + 0.25 or Higher it is considered expansionary, + 0.25 to 0.00 is considered cautionary, and anything under 0.00 slope is considered Recessionary Source: Federal Reserve
Credit Spread - Credit spreads refer to the difference between higher quality us treasury and less than investment grade quality (Junk) debt of the same maturity. A sudden widening of the difference in yield (spread) indicates growing concern about the ability of corporate (and other private) borrowers to service their debt. Narrowing credit spreads indicate improving private creditworthiness. Source: ICE BofAML US Corporate BBB Option-Adjusted Spread / Federal Reserve
Money Supply - When economic growth slows the federal reserve will help influence the increase in the money supply. This is a sign that growth has slowed. When the economy get overheated (too much growth) the Federal Reserve will influence the money supply by helping to reduce the money supply. Sources: BLS, Board of Governors
Wage Growth - Wage growth is one of the main indications to measure economic growth for the long-term since it reflects the consumer's purchasing power in the economy. However, wages growing too fast may cause to quick an increase in inflation. Wages growing to slow make it difficult for an economy to grow. Growth under 3.5% Y/Y is considered not optimal Source: BEA
Producer Prices - In the United States, the Producer Price Index for final demand measures price change for commodities sold for personal consumption, capital investment, government, and export. It is composed of six main price indexes: final demand goods (33 percent of the total weight), which includes food and energy; final demand trade services (20 percent); final demand transportation and warehousing services (4 percent); final demand services less trade, transportation, and warehousing (41 percent); final demand construction (2 percent); and overall final demand. Source: Bloomberg
Housing Permits - Building Permits refer to the approvals given by a local jurisdictions before the construction of a new or existing building can legally occur. Not all areas of the United States require a permit for construction. Source: US Census Bureau
Jobless Claims - Initial jobless claims have a big impact in financial markets because unlike continued claims data which measures the number of persons claiming unemployment benefits, Initial jobless claims measures new and emerging unemployment. A multi-Quarter increase of Jobless claims can be seen as recessionary. Source: US Department of Labor
Retail Sales - Retail sales report in the US provides aggregated measure of sales of retail goods and services over a period of a month. There are thirteen major types of retailers: Motor vehicle & parts dealers, Food & beverage stores, General merchandise stores , Food services & drinking places, Gasoline stations, Nonstore retailers, Building material & garden dealers, Health & personal care stores, Clothing & clothing accessories stores, Miscellaneous store retailers, Furniture stores, Electronics & appliance stores and Sporting goods, hobby, book & music stores. Source: US Census Bureau
Job Sentiment - When individuals have an optimistic outlook on the job market, they are more inclined to spend. When they are worried about the prospects of the job market they may be more likely to cut expenditures. Source: Conference Board
ISM New Orders - The ISM index is a good leading indicator of the economy and is useful in gauging turning points in the business cycle. A headline number above 50 is consistent with both manufacturing and economic expansion. An index below 43 for an extended period is consistent with an economy in recession. Our report allows for a recession to be called after 2 consecutive quarters of decline. Source: ISM
Profit Margins - Profit margins contract if profits fall faster than costs can be cut. Declining profit margins are a warning sign of economic activity and in subsequent warning of recession. Slowing profit margins for multiple quarters is considered recessionary. Source: BEA
Truck Shipments - 70% of all freight in the US is moved by Truck. If the indication is that fewer products are shipping (Represented in a decrease in tons shipped) for an extended period of time at increasing amounts it is considered recessionary. Source ATA
References:
https://www.zillow.com/research/2026-housing-predictions-35800/
https://www.cbsnews.com/news/venezuela-maduro-trump-oil-stock-prices-chevron-cvx/
https://www.federalreserve.gov/monetarypolicy/files/BeigeBook_20251126.pdf
https://www.chicagofed.org/publications/chicago-fed-letter/2021/452
https://www.econstor.eu/bitstream/10419/54325/1/515560839.pdf
https://stockcharts.com/freecharts/pnf.php?c=VDC%3AVCR,PWUADANRNO[PA][D][F1!3!2.0!!2!20]
https://stockcharts.com/freecharts/pnf.php?c=VPU%3AXLF,PWUADANRNO[PA][D][F1!3!2.0!!2!20]
https://stockcharts.com/freecharts/pnf.php?c=JNK%3ATLT,PWUADANRNO[PA][D][F1!3!2.0!!2!20]