
Better than expected outcomes - Revisited
Hello Everybody,
Summer is in full swing, and if your household is anything like mine, you're probably juggling the joys and chaos that come with it.
Our three daughters have kept busy — swimming nearly every day, diving headfirst into craft projects, and evening park trips to take advantage of the cooler weather. It’s been full of energy and creativity—and a reminder that the hot summer weather has a way of changing plans.
Yet, much like the unpredictability of a summer with kids, the market has offered us its fair share of twists.
Of course, we continued to stick to our process, monitor the landscape, and stay grounded.
Better Than Expected Outcomes — Revisited
In our previous outlook, “Better Than Expected Outcomes,” published on April 7th, we discussed the strong potential for a "V-shaped" recovery. While I never claim to call market bottoms—and certainly didn’t on April 7th—the data strongly suggested a turning point was near. It just so happened that my outlook went out that very day.
Since then, markets have shown remarkable resilience, hitting new all-time highs across several major indices. What we discussed in April wasn’t just a hunch; it was a data-informed call based on a combination of improving technical indicators and fading pessimism.
While headlines remained focused on fear, the market’s internals were strengthening. This is exactly why a process-driven investment approach is so essential.
Tariffs, Inflation & Resilient Technicals
With tariffs back in the spotlight and inflation remaining a lurking concern, it’s worth noting that markets are not currently pricing in a major re-acceleration in inflation expectations.
We can see this clearly in several key relative strength “ratio” charts—such as Consumer Staples vs. the S&P 500 and Energy vs. the S&P 500. These ratio charts compare how defensive (Staples) and cyclical (Energy) sectors are performing relative to the broader market.

Energy vs. S&P 500

Consumer Staples vs. S&P 500
Looking at past data, inflation expectations began rising in early 2021 and persisted through 2022. During that period, both Consumer Staples and Energy outperformed the broader market, as investors rotated into more inflation-resilient areas.
Today, however, these sectors are underperforming.
That tells us something important: investors are still favoring risk assets. While this can change at any time and needs to be watched, it suggests that under the surface, markets remain structurally strong.
Despite negative headlines—tariffs, inflation fears, and concerns about consumer spending health — the technical picture continues to support the case that we’re still in a secular bull market.
This long-term, multi-cycle trend is driven by strong demographics, technological adoption, and improved capital allocation. (See the chart below for a visual representation.)
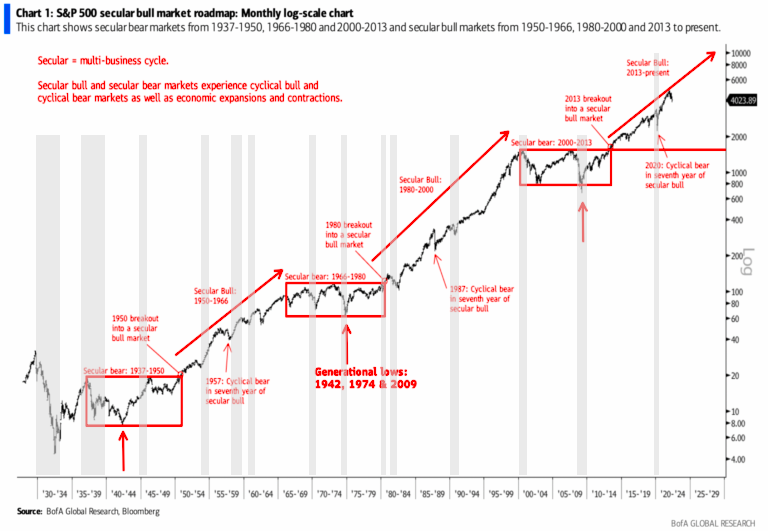
Secular Bull and Bear market historical chart
Remaining Aware of Risks: LEI, Consumers & Tariff Deadlines
Let’s be clear: just because markets are acting strong doesn’t mean the risks have disappeared.
In June, the Conference Board’s Leading Economic Index (LEI) turned negative again—marking its third monthly decline and flashing a recession warning.

Leading Economic Indicator June 2025
Oddly enough, this signal triggered in late ‘21 or early ‘22. I even wrote a piece high lighting it as a significant piece of information. At the time, no recession was called. A little twilight zone moment if you ask me.
In any event, the June LEI was released with this comment form The Conference Board:
“…while the diffusion index over the past six months remained below 50, triggering the recession signal for a third consecutive month. At this point, The Conference Board does not forecast a recession, although economic growth is expected to slow substantially in 2025 compared to 2024. Real GDP is projected to grow by1.6% this year, with the impact of tariffs becoming more apparent in H2 as consumer spending slows due to higher prices.”
In fact, we saw early signs of softening consumer spending in June, particularly in services. This could be the result of front-loaded consumption earlier in the year—possibly in anticipation of tariffs—or simply tightening financial conditions. Either way, we’re watching this closely, given the consumer’s significant contribution to GDP.
Looking ahead, August 1st looms as a key date for tariff clarity. If the administration doesn’t settle the details by then, it could become an overhang for the fourth quarter.
As of now, markets do not appear to be pricing this in meaningfully.
While we remain optimistic, we also remain vigilant. The conditions for market volatility is never off the table.
For example, the S&P 500 still has an open gap from early July—about 4.7% below current levels. Historically, “breakaway” gaps like this have a ~65% chance of being filled. However, the farther the market gets from the gap, thelower that probability becomes. It could take weeks— or even months — to fill, if it ever does. (see chart below)
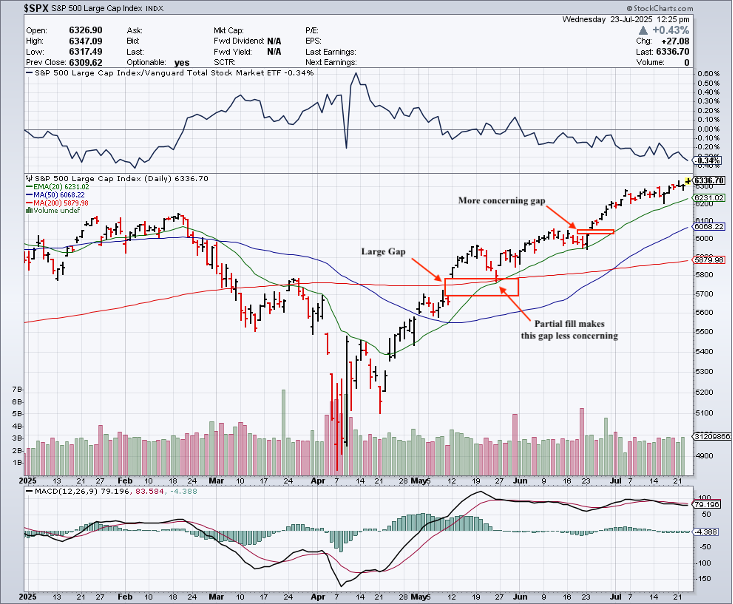
S&P 500 Showing Gaps
Secular Bull Market Trend — Still in Motion
As we've highlighted in past outlooks, we firmly believe we are still in the midst of a long-term secular bull market that began in 2009 and was confirmed in 2013. This trend remains intact, and we believe it could extend into the early 2030’s — potentially even 2035—driven by macroeconomic and demographic tailwinds.
Importantly, even within a secular bull, corrections and bear markets happen—think 2022, or more recently Dec. to April of this year.
These are normal and even healthy. If our secular bull market thesis is to hold, short-term pullbacks should be seen as opportunities to add exposure if not already allocated or in a tactically minded strategy.
Remaining disciplined during these moments is what builds long-term value.
Final Thoughts: Staying Engaged & Prepared
At the end of the day, we operate with the understanding that market risk isever-present. The probability of downside may vary, but it never goes to zero.
That’s why we remain disciplined—conducting regular portfolio reviews,monitoring economic signals, and staying focused on what matters most.
We're here. We're engaged. And we're always available for a conversationabout your goals, your plan, or what’s on your mind.
I hope you and your families are well and enjoying the time together thissummer.
Thanks for reading,
James Anadon

OWM Economic Dashboard
Economic Dashboard - Information
Yield Curve - A steeper Yield Curve shows that bond investor sentiment is more optimistic about economic activity moving into the future. If the 10 Year treasury minus the 3 Month Treasury provides a positive slope of + 0.25 or Higher it is considered expansionary, + 0.25 to 0.00 is considered cautionary, and anything under 0.00 slope is considered Recessionary Source: Federal Reserve
Credit Spread - Credit spreads refer to the difference between higher quality us treasury and less than investment grade quality (Junk) debt of the same maturity. A sudden widening of the difference in yield (spread) indicates growing concern about the ability of corporate (and other private) borrowers to service their debt. Narrowing credit spreads indicate improving private creditworthiness. Source: ICE BofAML US Corporate BBB Option-Adjusted Spread / Federal Reserve
Money Supply - When economic growth slows the federal reserve will help influence the increase in the money supply. This is a sign that growth has slowed. When the economy get overheated (too much growth) the Federal Reserve will influence the money supply by helping to reduce the money supply. Sources: BLS, Board of Governors
Wage Growth - Wage growth is one of the main indications to measure economic growth for the long-term since it reflects the consumer's purchasing power in the economy. However, wages growing too fast may cause to quick an increase in inflation. Wages growing to slow make it difficult for an economy to grow. Growth under 3.5% Y/Y is considered not optimal Source: BEA
Producer Prices - In the United States, the Producer Price Index for final demand measures price change for commodities sold for personal consumption, capital investment, government, and export. It is composed of six main price indexes: final demand goods (33 percent of the total weight), which includes food and energy; final demand trade services (20 percent); final demand transportation and warehousing services (4 percent); final demand services less trade, transportation, and warehousing (41 percent); final demand construction (2 percent); and overall final demand. Source: Bloomberg
Housing Permits - Building Permits refer to the approvals given by a local jurisdictions before the construction of a new or existing building can legally occur. Not all areas of the United States require a permit for construction. Source: US Census Bureau
Jobless Claims - Initial jobless claims have a big impact in financial markets because unlike continued claims data which measures the number of persons claiming unemployment benefits, Initial jobless claims measures new and emerging unemployment. A multi-Quarter increase of Jobless claims can be seen as recessionary. Source: US Department of Labor
Retail Sales - Retail sales report in the US provides aggregated measure of sales of retail goods and services over a period of a month. There are thirteen major types of retailers: Motor vehicle & parts dealers, Food & beverage stores, General merchandise stores , Food services & drinking places, Gasoline stations, Nonstore retailers, Building material & garden dealers, Health & personal care stores, Clothing & clothing accessories stores, Miscellaneous store retailers, Furniture stores, Electronics & appliance stores and Sporting goods, hobby, book & music stores. Source: US Census Bureau
Job Sentiment - When individuals have an optimistic outlook on the job market, they are more inclined to spend. When they are worried about the prospects of the job market they may be more likely to cut expenditures. Source: Conference Board
ISM New Orders - The ISM index is a good leading indicator of the economy and is useful in gauging turning points in the business cycle. A headline number above 50 is consistent with both manufacturing and economic expansion. An index below 43 for an extended period is consistent with an economy in recession. Our report allows for a recession to be called after 2 consecutive quarters of decline. Source: ISM
Profit Margins - Profit margins contract if profits fall faster than costs can be cut. Declining profit margins are a warning sign of economic activity and in subsequent warning of recession. Slowing profit margins for multiple quarters is considered recessionary. Source: BEA
Truck Shipments - 70% of all freight in the US is moved by Truck. If the indication is that fewer products are shipping (Represented in a decrease in tons shipped) for an extended period of time at increasing amounts it is considered recessionary. Source ATA
References: